Reading Backtest Reports
Overview
| Item | Description |
|---|---|
| Goal | Understand PNG, HTML, Markdown, and JSON reports |
| Prerequisite | Running a Backtest |
1. Backtest Report & Chart Guide
1.1 Charts (PNG)
Chart file: reports/backtest_YYYYMMDD_HHMMSS.png
- Gray line (Close): Stock daily closing price
- Blue line (MA5): 5-day moving average (short-term trend)
- Orange line (MA20): 20-day moving average (medium-term trend)
- Green circles (BUY): Buy signals
- Red circles (SELL): Sell signals
- Green shaded area: Holding period
- Green line (right axis): Portfolio total asset value
1.2 Interactive HTML Report
File: reports/backtest_YYYYMMDD_HHMMSS.html — open with a browser.
The page is organized top-to-bottom:
- Header summary — Backtest target, date range, initial/final capital; quickly assess profitability
- Core metric cards — Annualized return, excess return, Sharpe ratio, max drawdown, win rate, Calmar ratio
- Detailed metric row — Annualized volatility, Sortino ratio, Alpha, Beta, information ratio, daily win rate, profit/loss ratio
- Candlestick & technical indicators chart — Price candles + moving averages + buy/sell markers + volume bars
- Cumulative returns — Strategy overlaid with CSI 300 and SSE Composite cumulative return curves
- Drawdown curve — Strategy drawdown vs. the two index drawdowns
- Daily P&L — Profit/loss bar chart for each trading day
- Tabs — Trade details, position status
Full reading workflow: Header (did it make money?) → Metric cards (is the Sharpe/drawdown acceptable?) → Cumulative return chart (position relative to broad market) → Drawdown curve → Trade table.
1.3 Markdown Report
File: reports/backtest_YYYYMMDD_HHMMSS.md — contains summary, trade records, and position information.
1.4 JSON Report
File: reports/backtest_YYYYMMDD_HHMMSS.json — machine-readable structured data.
import json
with open('reports/backtest_20240101_120000.json') as f:
    report = json.load(f)
print("Total return: %.2f%%" % report['pnl_pct'])
2. Risk & Attribution Analysis
2.1 analyze_returns: Comprehensive Risk Metrics
| Metric | Description | Good Value |
|---|---|---|
total_return |
Total return rate | Positive, the higher the better |
annual_return |
Annualized return rate | Positive, the higher the better |
annual_volatility |
Annualized volatility | Lower is better |
sharpe_ratio |
Sharpe ratio | > 1 is good, > 2 is excellent |
sortino_ratio |
Sortino ratio | Only considers downside risk; > 1 is good |
max_drawdown |
Max drawdown | Closer to 0 is better |
calmar_ratio |
Calmar ratio | > 1 is good |
alpha |
Excess return (annualized) | Positive means outperforming benchmark |
beta |
Market sensitivity | 1 means moving in sync with the market |
information_ratio |
Information ratio | > 0.5 is good |
win_rate_daily |
Daily win rate | > 0.5 is good |
win_rate_trade |
Paired-trade win rate | Different meaning from daily win rate |
2.2 brinson_attribution: Attribution Analysis
from eqlib import brinson_attribution
attr = brinson_attribution(result)
print("Allocation effect: %.4f" % attr['allocation_effect'])
print("Selection effect: %.4f" % attr['selection_effect'])
2.3 simple_factor_analysis: Factor Analysis
from eqlib import simple_factor_analysis
ff = simple_factor_analysis(result)
print("Market Beta: %.3f" % ff['market_beta'])
Note: This function does not implement the true Fama-French three-factor model. The
momentum_correlationfield is return autocorrelation, not a true momentum factor exposure.fama_french_analysisis deprecated; usesimple_factor_analysisinstead.
See the Report Format Specification for detailed metric field definitions.
3. What You Get After Running
In your code, call:
from eqlib import run_strategy

result = run_strategy(
    initialize,
    start_date="2024-01-01",
    end_date="2024-12-31",
    starting_cash=100_000,
    benchmark="000300.XSHG",
    securities=["601390"],
    report_dir="reports",
)
The terminal will print file paths (timestamps vary each run):
| File | Purpose |
|---|---|
reports/backtest_YYYYMMDD_HHMMSS.png |
Static chart: price, moving averages, buy/sell signals, portfolio NAV/drawdown, etc. (related to strategy implementation) |
reports/backtest_YYYYMMDD_HHMMSS.html |
Interactive report: metric cards, candlestick chart, cumulative returns, drawdown, daily P&L, trades and positions, etc. |
reports/backtest_YYYYMMDD_HHMMSS.md |
Human-readable summary + tabular trade records |
reports/backtest_YYYYMMDD_HHMMSS.json |
Structured data for programmatic analysis |
Open the .html file directly in your browser (double-click or File → Open) — no web server needed.
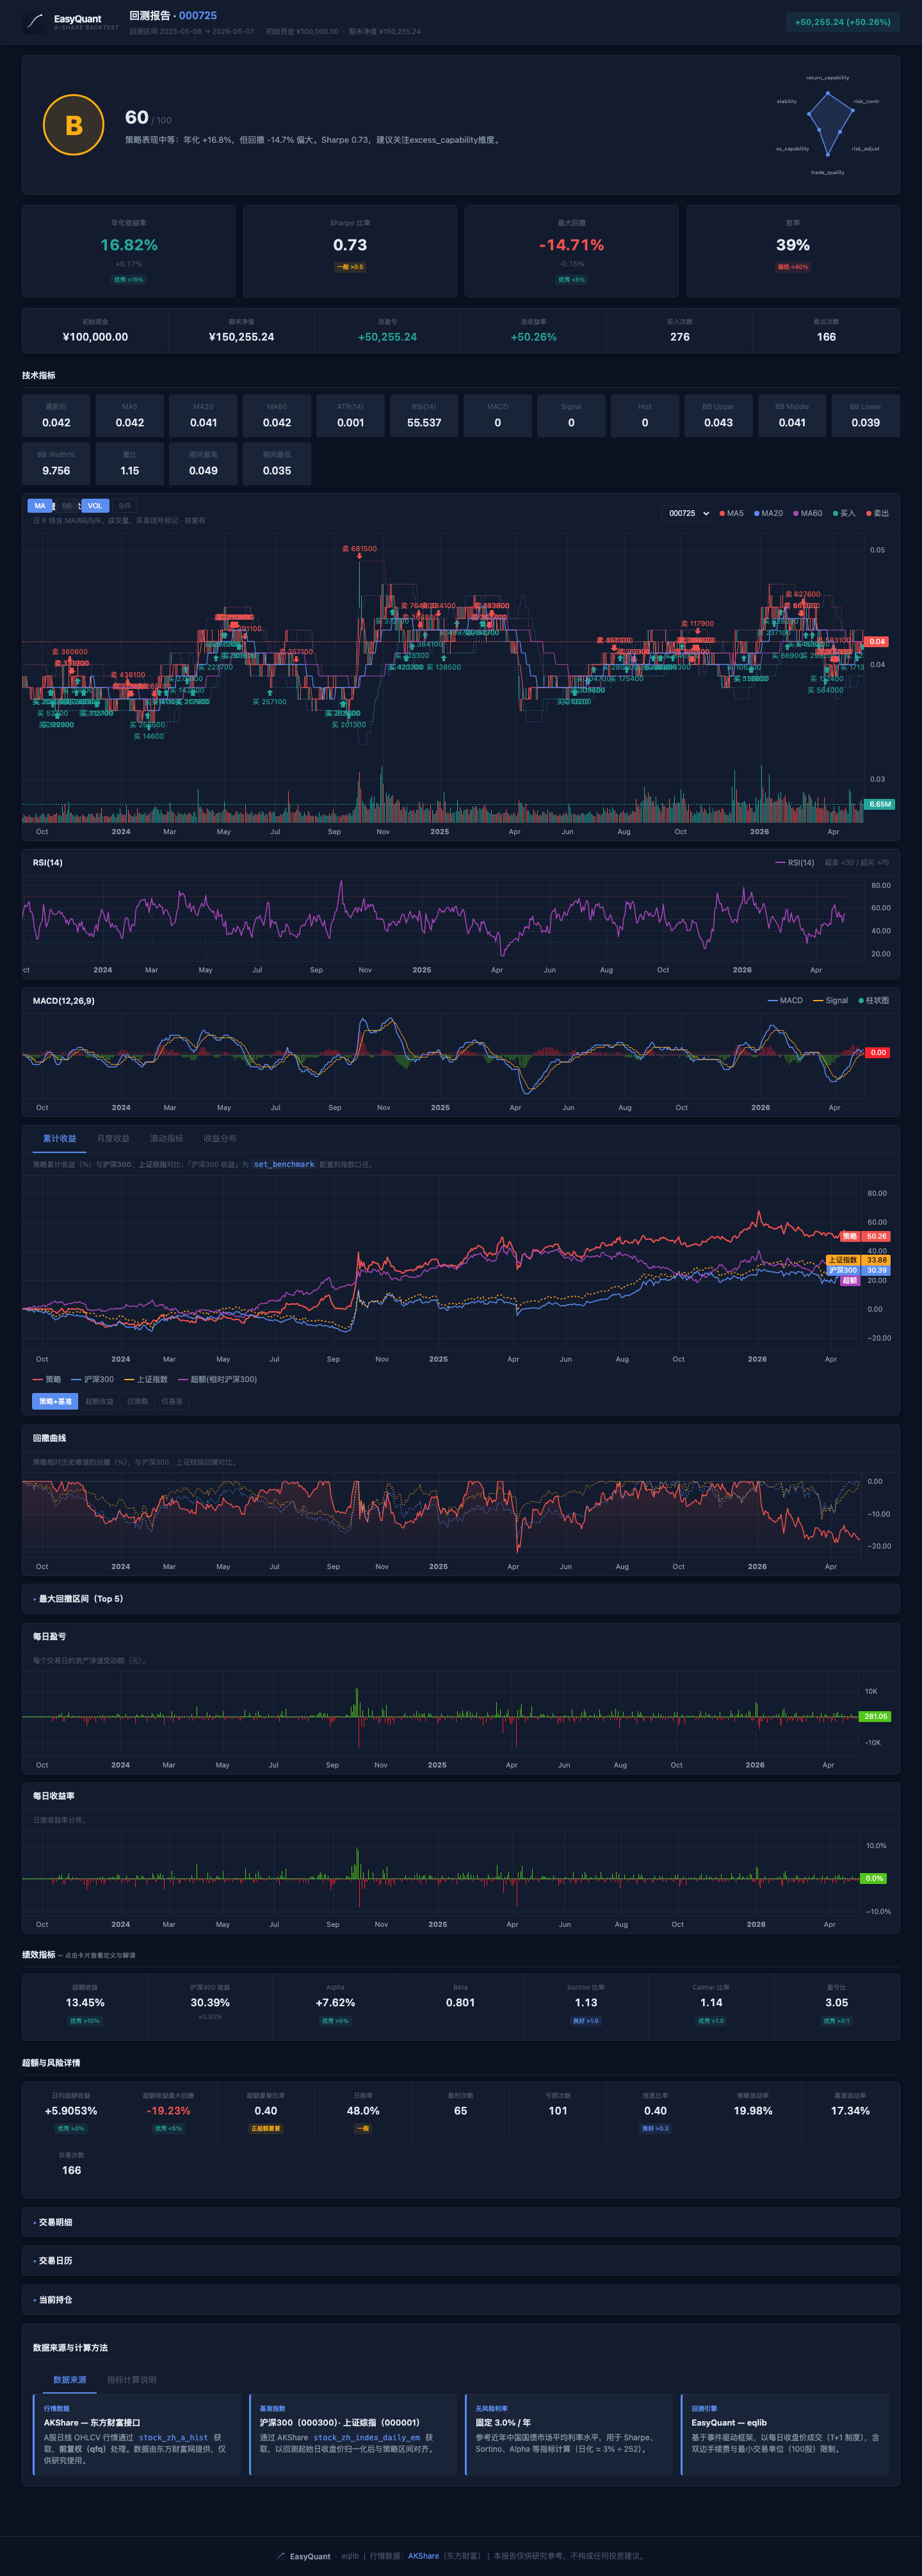
3.1 HTML Report Page Overview
After opening the .html file, the page is roughly divided into the following sections (screenshot below is from an Example 22 stock selection strategy backtest):
Header (title + P&L amount) → Core metric cards → Detailed metric row → Candlestick chart → Cumulative returns → Drawdown → Daily P&L → Trades/positions tabs.
4. HTML Report Page Structure (Top to Bottom)
Below is the logical order of sections generated by generate_html_report, to help you follow along on screen.
4.1 Header
- Title: Backtest target or portfolio description.
- Summary area: Backtest period, initial capital, final assets, P&L amount and percentage, etc.
4.2 Metric Cards (Click for Details)
Common fields and how to read them:
| Display Name / Field | Intuitive Meaning |
|---|---|
| Annualized Return | The compound annual return extrapolated from the full backtest period; useful for cross-period comparison |
| Excess Return | The strategy's total return minus the benchmark's total return |
| Benchmark Return | The benchmark index gain/loss over the same period |
| Alpha | Annualized excess return after regressing against the benchmark (the "beat/miss" portion in CAPM terms) |
| Beta | Elasticity relative to the broad market; around 1 means moving with the index, above 1 means more volatile |
| Sharpe Ratio | Return above the risk-free rate per unit of total volatility; generally > 1 is considered acceptable |
| Win Rate (Trade) | Percentage of profitable round-trips among all completed buy–sell pairs → corresponds to win_rate_trade |
| Profit/Loss Ratio | Average winning trade / average losing trade (absolute value ratio) |
| Max Drawdown | Largest decline from a historical peak to the subsequent trough; a negative number — smaller absolute value means better risk control |
| Sortino Ratio | Similar to Sharpe, but the denominator uses only downside volatility; focuses more on "how painful the drops are" |
| Calmar Ratio | Annualized return / |max drawdown|; higher when drawdown is small and returns are high |
| Daily Excess Return (Annualized) | Annualized mean of daily excess returns |
| Excess Max Drawdown | Max drawdown on the excess return series |
| Excess Sharpe | Sharpe ratio of daily excess returns |
| Daily Win Rate | Profitable trading days / total trading days → win_rate_daily |
| Profitable Trades / Losing Trades | Counts after paired-trade matching |
| Information Ratio | Efficiency of active return relative to tracking error |
| Annualized Volatility | Annualized standard deviation of strategy daily returns |
| Benchmark Volatility | Annualized volatility of benchmark daily returns |
| Trade Count | Number of completed paired trades |
The "rating bar" on each card provides a color-coded quick hint based on thresholds — your own strategy targets should always take precedence.
4.3 Candlestick & Technical Chart Area (If Present)
The title is typically "Candlestick Chart · Technical Indicators": the main chart shows OHLCV candlesticks, volume bars, MA overlays, and buy/sell signal markers.
Technical Indicators
| Indicator | Description |
|---|---|
| MA Moving Averages | MA5 (red), MA20 (blue), MA60 (purple) — three moving average lines overlaid on the main candlestick chart |
| RSI(14) | Separate chart with 70 overbought line (red dashed), 30 oversold line (green dashed), and 50 midline (gray dashed) |
| MACD(12,26,9) | Separate chart with MACD line (blue), Signal line (orange), histogram (red/green bars), and zero-axis reference line |
| Bollinger Bands(20,2) | Optionally overlaid on the candlestick chart: upper band, middle band, lower band |
Indicator Toggle Panel
Floating button groups in the top-left corner of the candlestick chart allow toggling indicators independently:
| Button | Default State | Function |
|---|---|---|
| MA | On | Show/hide MA5/MA20/MA60 moving averages |
| BB | Off | Show/hide Bollinger Bands upper and lower bands |
| VOL | On | Show/hide volume bars |
| S/R | Off | Show/hide support/resistance lines |
Crosshair Linked Legend
When moving the mouse over the candlestick chart, the top-left corner displays real-time values at the cursor position:
- OHLC prices
- MA5/MA20/MA60 values
- RSI value
- MACD / Signal / Histogram values
- BB upper/middle/lower bands
- Volume
4.4 Cumulative Returns
- Strategy cumulative return (%) curve.
- CSI 300 and SSE Composite two benchmark lines: cumulative gain/loss (%) aligned to the same backtest period and same trading days as the strategy, making it easy to judge whether the strategy outperforms or underperforms the broad market (independent of
set_benchmarkconfiguration — the chart always shows both benchmarks). - Excess (vs. CSI 300): Displayed under the "Excess Return" tab; calculated as strategy cumulative return minus CSI 300 cumulative return. The "Excess Return" metric card still uses
analyze_returnsrelative to the benchmark you set.
4.5 Drawdown Curve
- Green area: Strategy NAV drawdown (%) relative to its own historical peak.
- Blue dashed line: CSI 300 index drawdown relative to its period peak.
- Orange dashed line: SSE Composite drawdown relative to its period peak. Use for comparison: during broad market corrections, is the strategy's drawdown larger? Does it follow the market down?
4.6 Daily P&L / Daily Return
Bar or curve showing day-over-day portfolio value changes; useful for spotting "consecutive losses" or "concentrated volatility."
4.7 Tabs: Trades, Calendar, Positions, etc.
- Trades: Time, price, quantity, and commission for each buy/sell.
- Positions: Position structure at period-end or key milestones (as actually exported).
- Other tabs provide supplementary information (e.g., data source notes).
4.8 Walkthrough Example
Below is a real export (target 601398, period 2021-06-06 to 2024-06-06) explaining what each section means when you open the HTML. After running python examples/06_local_data.py, open the latest *.html in reports/ and read along with the table below (values below are a snapshot from that run, same source as the tutorial screenshots).
Note: This example strategy is a simple MA 5/20 crossover strategy that made a modest profit in this period — positive Sharpe, controlled drawdown, and a decent win rate make it a good example for understanding what a "normal" strategy report looks like.
| Location in HTML | Approx. Value in This Example (see MD/JSON) | How to Read |
|---|---|---|
| Header / Total P&L | About +16.11% | Total return over the full period (relative to initial capital); matches summary.pnl_pct and risk_metrics.total_return. |
| Summary row | Initial 100,000 → Final 116,108 | Portfolio NAV after deducting trading costs. |
| Annualized Return | +5.15% | Annualized level derived from daily returns; slightly above the risk-free rate (~3%) but not spectacular. |
| Annualized Volatility | 12.83% | Magnitude of return fluctuations; moderate, the curve is not too "jagged." |
| Sharpe Ratio | +0.22 | Risk-adjusted return; slightly above 0, indicating modest excess return after accounting for risk. |
| Sortino Ratio | +0.31 | Downside-risk-only adjusted metric; also positive when Sharpe is positive. |
| Max Drawdown | -14.45% | Largest peak-to-trough decline; moderate drawdown in this example means manageable risk-control pressure. |
| Calmar Ratio | +0.36 | Annualized return / |max drawdown|; positive when returns are positive and drawdown is controlled. |
| Daily Win Rate | 29.4% | win_rate_daily: proportion of profitable trading days; this strategy holds positions for longer periods, so daily win rate is low but per-trade gains are substantial. |
| Win Rate (Trade) | 65.3% | win_rate_trade: proportion of profitable round-trips among completed buy–sell pairs; over half of the trades were profitable. |
| Profitable / Losing Trades | ~125 / 66 | Win/loss counts at the paired-trade level; more winning trades than losing ones. |
| Profit/Loss Ratio | 0.97 | Average winner vs. average loser; close to 1 means winning and losing trades are roughly similar in magnitude. |
| Trade Count (Paired) | ~95 | Number of completed "buy + sell" round-trips; differs from JSON summary.num_trades (one-sided trade count, 191 in this example) — see FAQ. |
| Annualized Turnover | Low | This is a low-frequency timing strategy with relatively low turnover. |
| Total Commission | 0.00 | This example uses local data backtesting, so commission shows as 0; in real trading, commissions would apply. |
| Alpha / Beta / Information Ratio | Depends on benchmark alignment | May be placeholders when the benchmark series is misaligned; when summary.benchmark_return is null, see FAQ. |
Interactive area (candlestick, cumulative returns, drawdown, daily P&L): Drag and zoom with the mouse; compare the strategy line vs. the benchmark line to see "did it beat the index?" If the entire chart area is blank, it's most likely due to CDN scripts being blocked by your network — you need internet access or a different network (see FAQ — HTML Charts Blank).
Taking your own full-page HTML screenshot (optional): Go fullscreen in the browser and use the system screenshot tool (e.g., macOS Cmd + Shift + 4, Windows Win + Shift + S) to capture the header + metric cards area for notes or sharing conclusions with colleagues.
5. How to Read the PNG Chart (generate_chart)
Typical elements include:
- Price and moving averages: Assess whether the trend and signals appear at reasonable levels.
- Buy/sell markers: Cross-reference with strategy logic — is there "chasing highs and panic selling"?
- Portfolio total value or return: Right-side or sub-chart — check whether the equity curve rises smoothly.
- Drawdown band: Bottom area showing drawdown depth.
If the chart is missing the NAV curve, check whether record / recorded data is complete per FAQ — PNG Is Sparse.
6. Comparing Reports Across Strategies: How to Judge Strategy Quality from Reports
Below are screenshots from 4 different strategies — same report structure, different numbers. Actual results will vary significantly depending on the backtest period, stock selection, and market conditions. These screenshots are for illustration only and do not imply the strategy will perform similarly in all market environments.
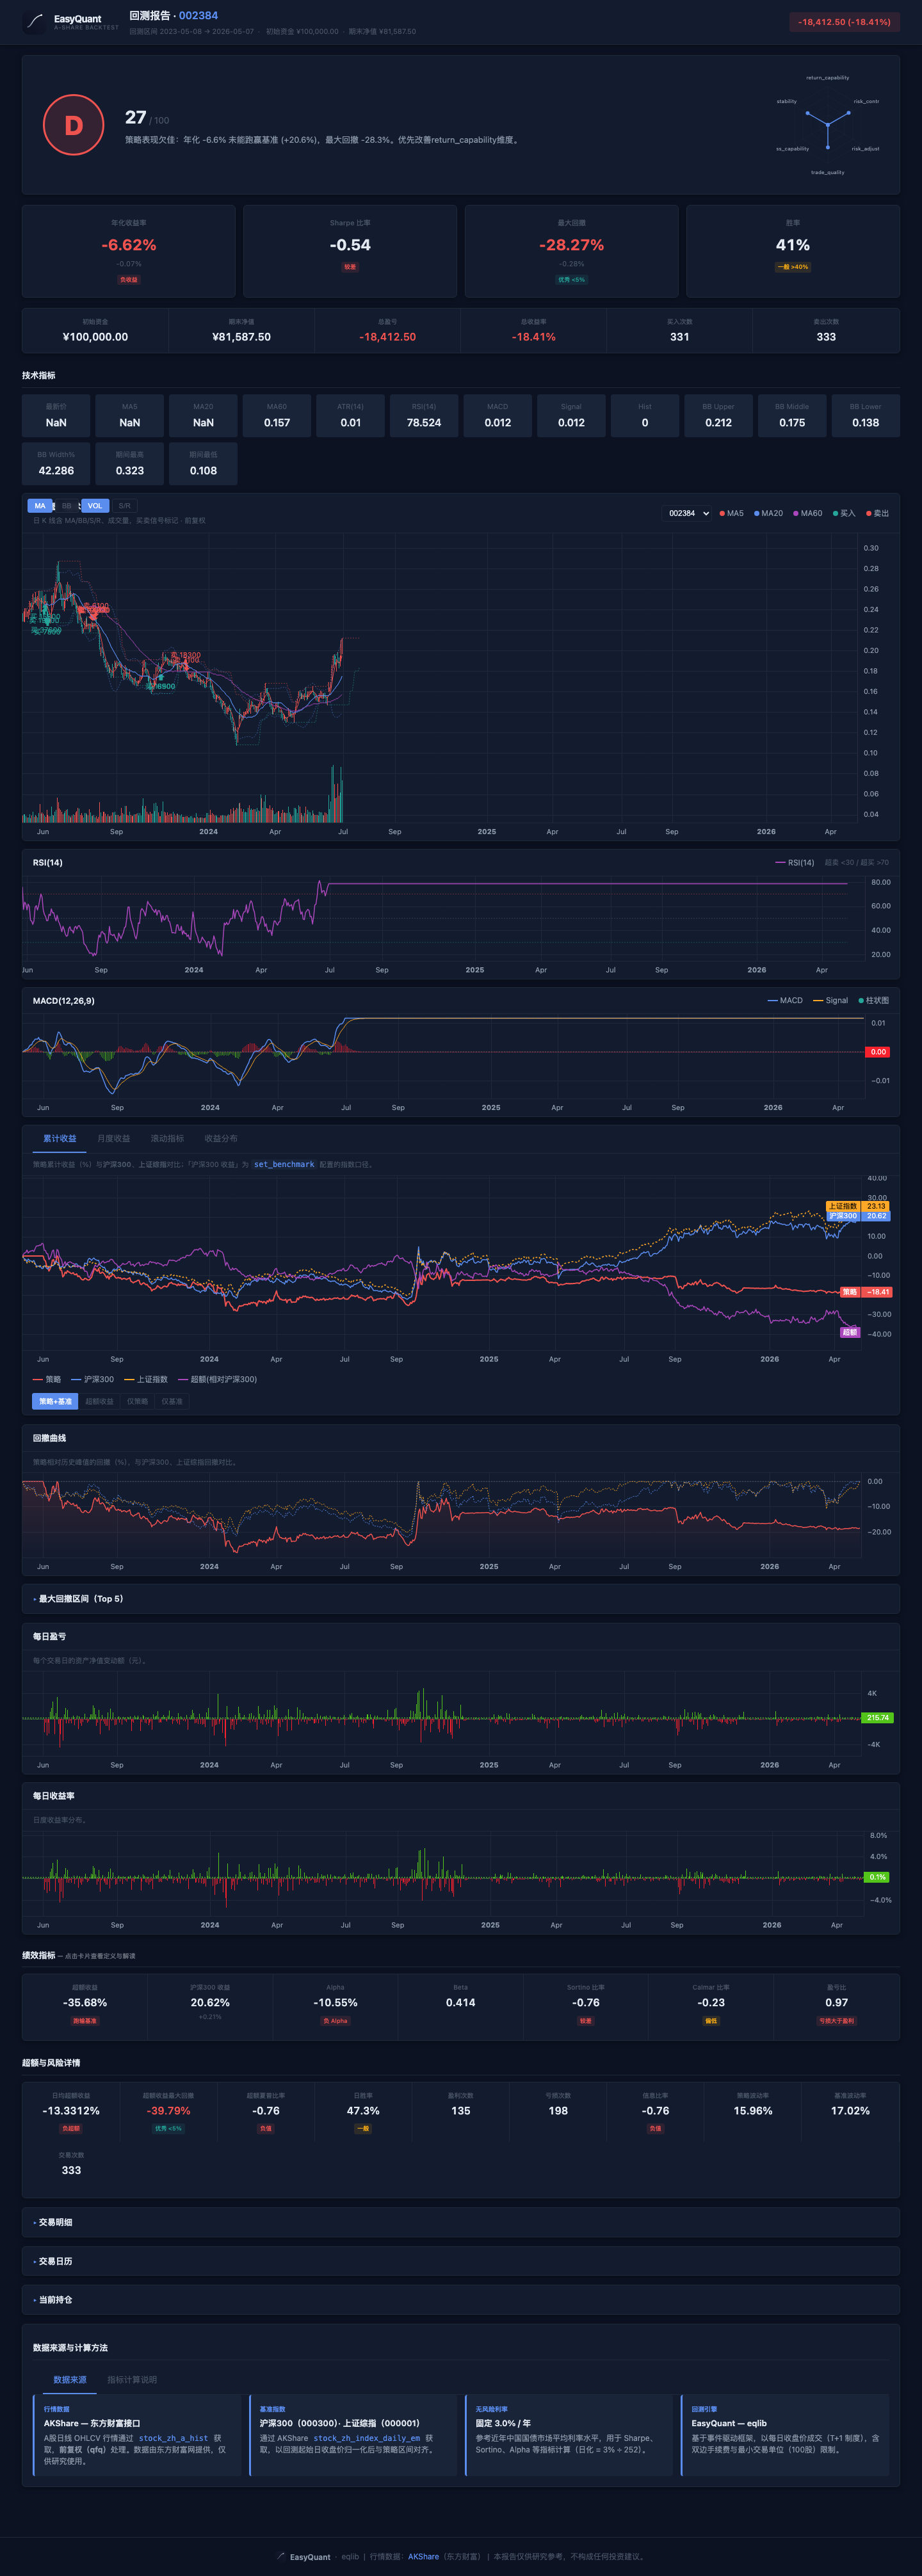
Strategy 1: MACD Trend + Volume Confirmation
- Type: Trend-following strategy relying on MACD golden cross with volume confirmation
- Key observation: Check whether Sharpe ratio is positive and the cumulative return curve trends upward
- Caveat: Trend strategies may underperform in ranging markets
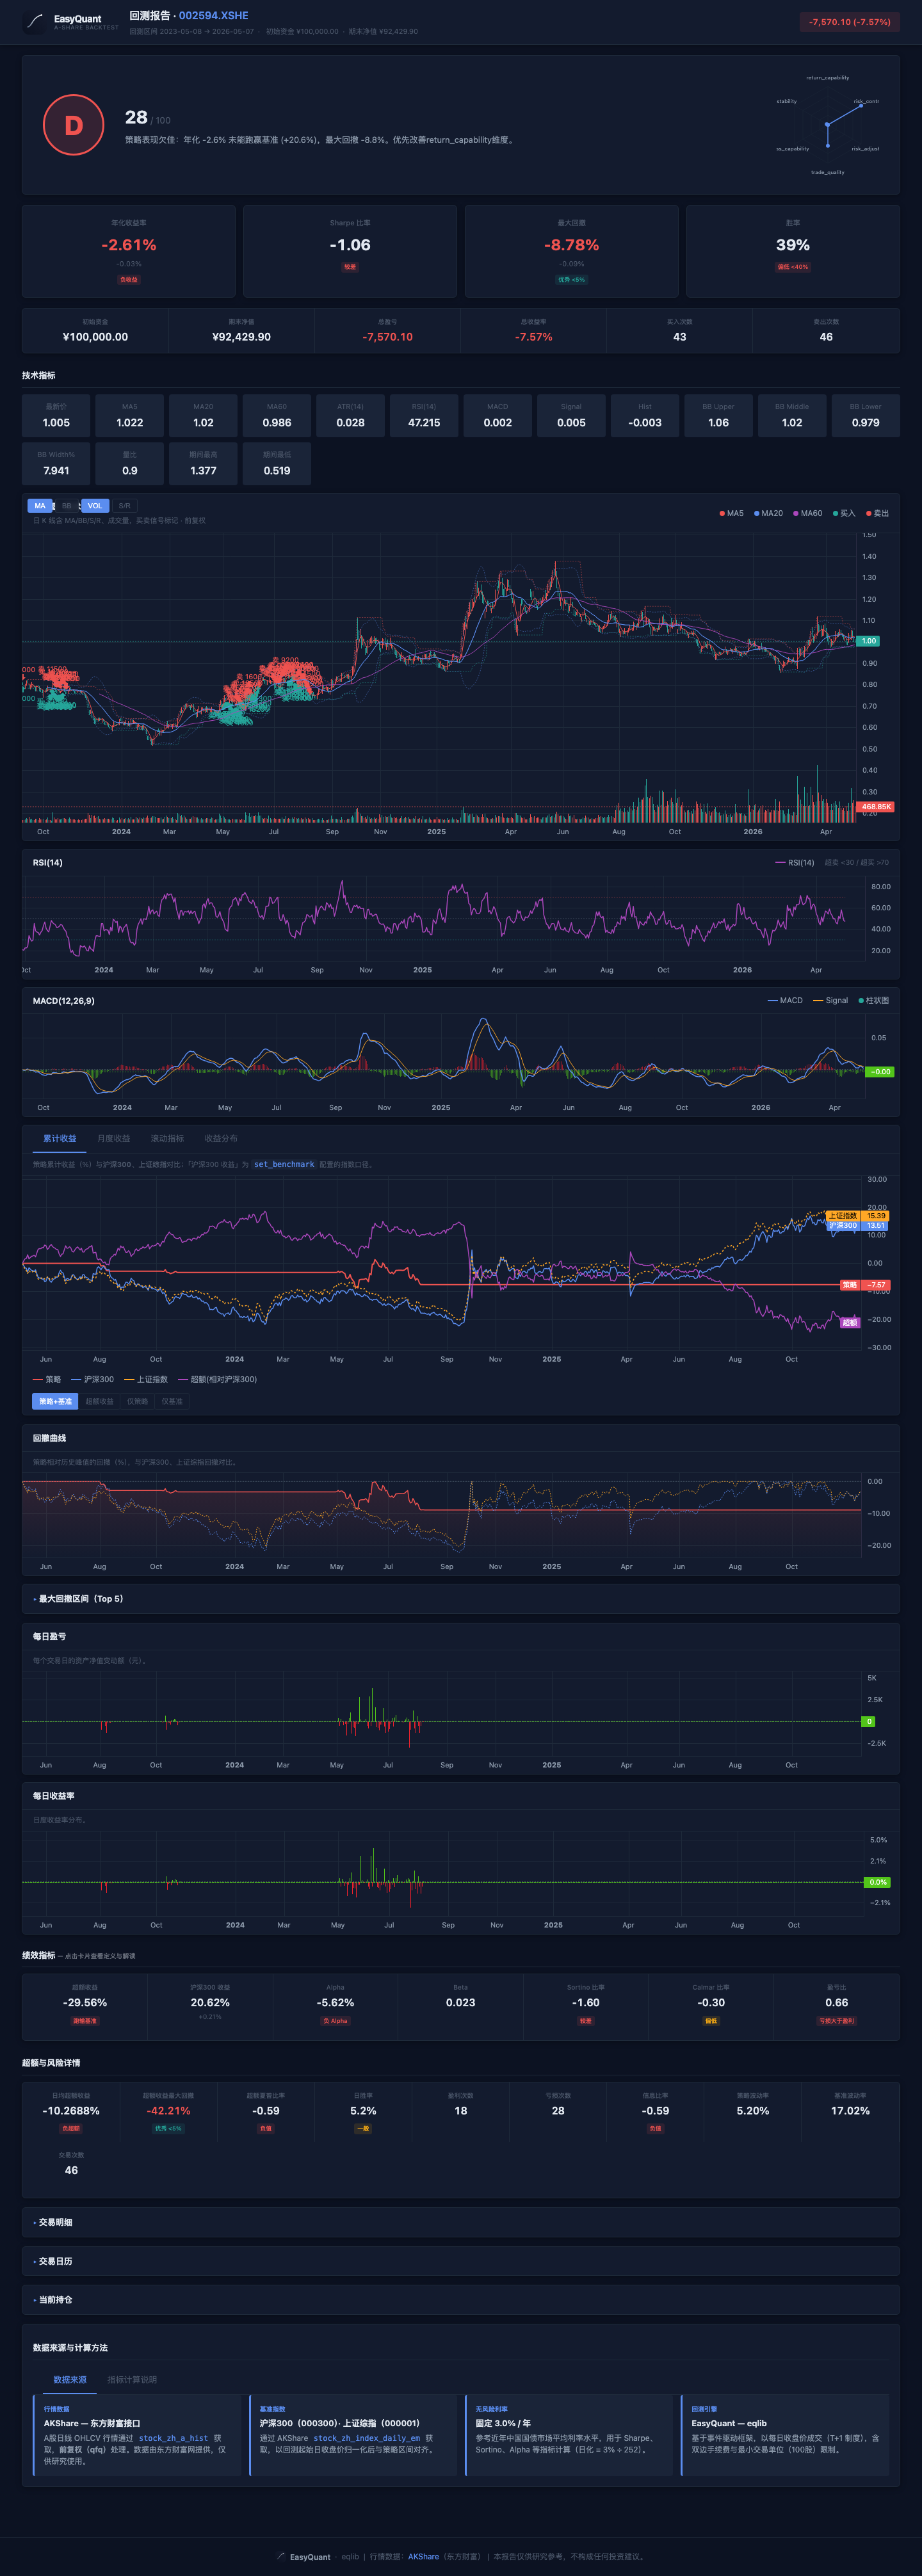
Strategy 2: Bollinger Band Mean Reversion
- Type: Mean-reversion strategy — buy near lower band, sell near upper band
- Key observation: Low trading frequency; tends to work well in ranging markets
- Caveat: May suffer consecutive losses during strong trending periods
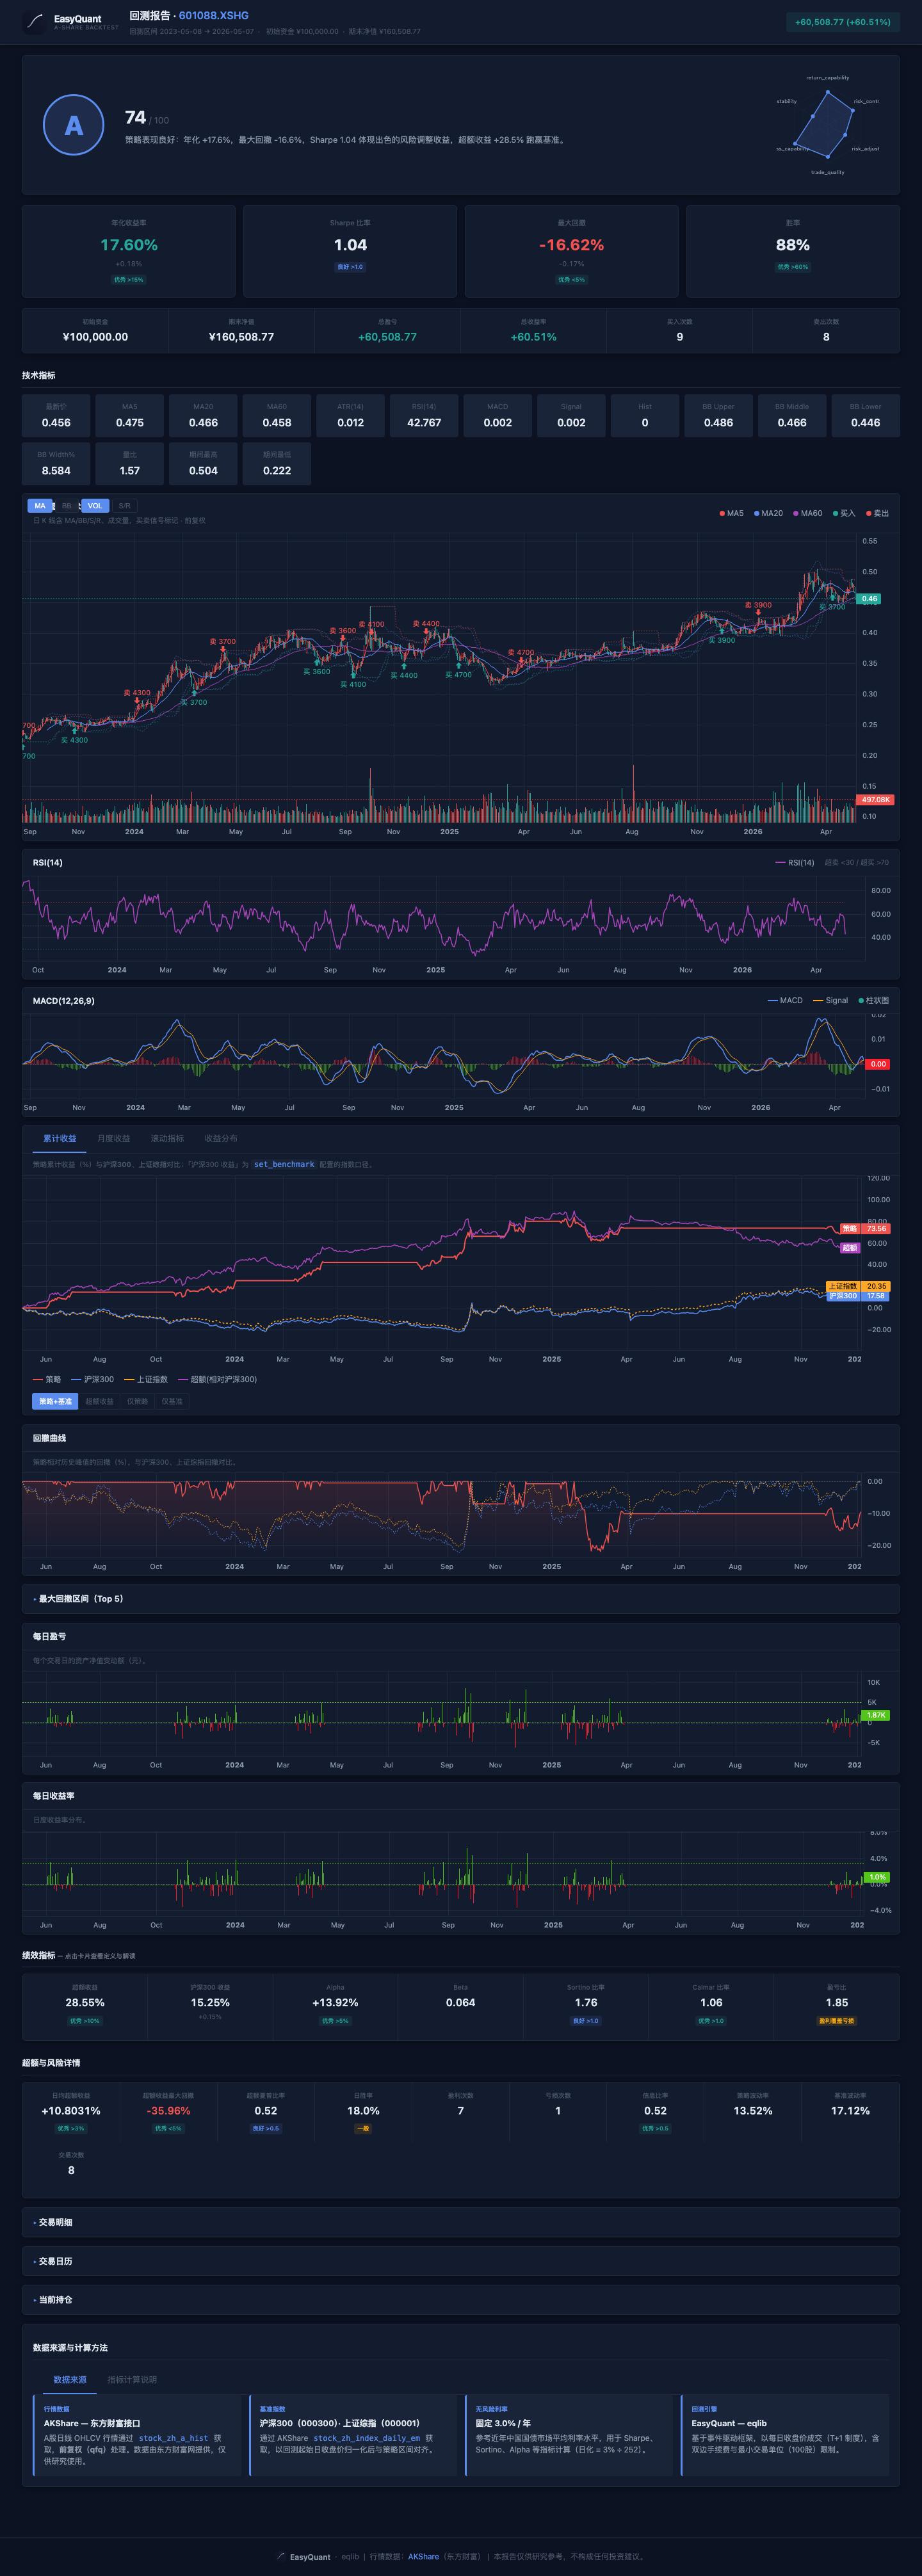
Strategy 3: Multi-Factor Stock Selection
- Type: Portfolio rotation across multiple stocks
- Key observation: Pay attention to turnover rate and commission cost erosion
- Caveat: High-frequency rotation can significantly reduce net returns
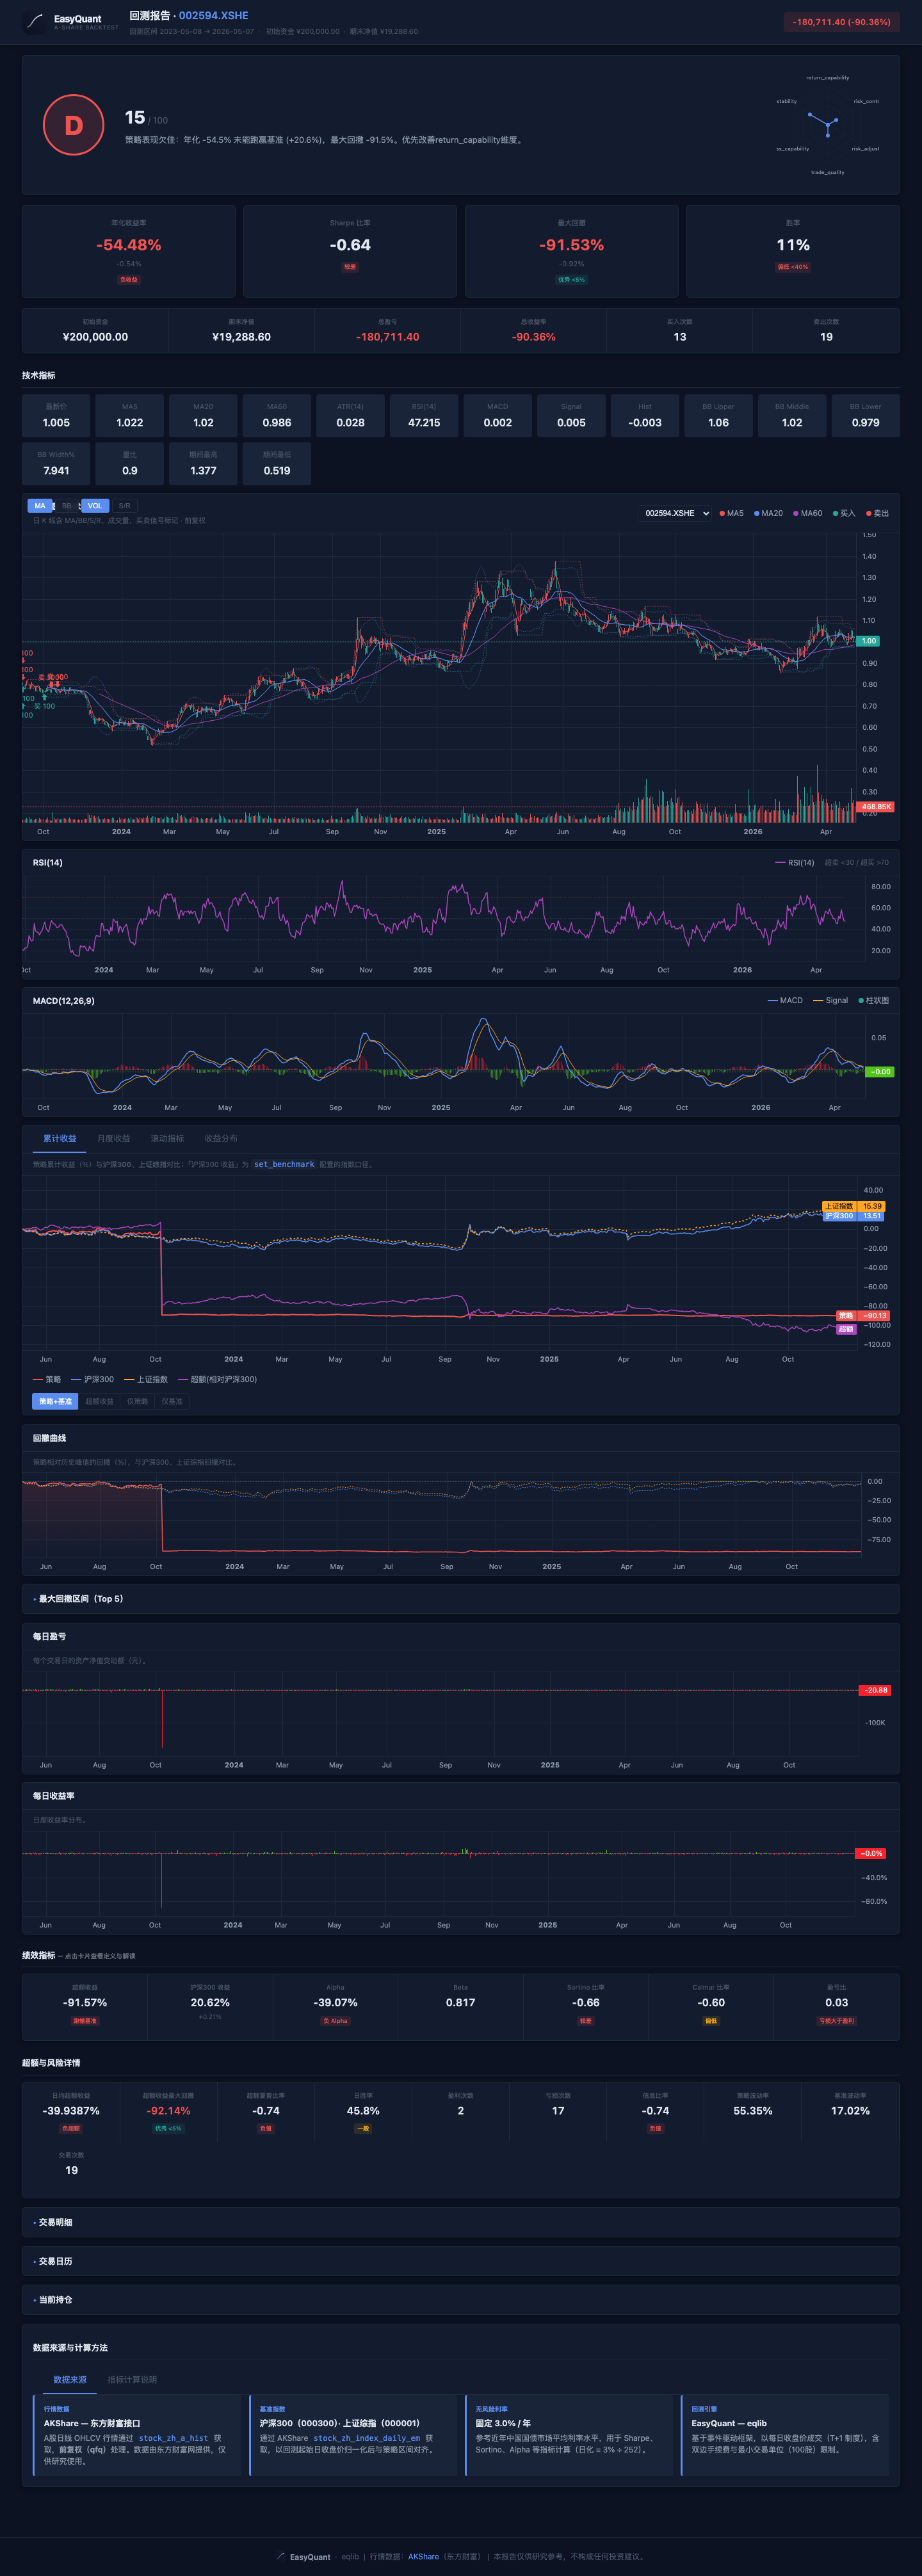
Strategy 4: Momentum Portfolio
- Type: Momentum strategy — buy recent outperformers
- Key observation: Check Sharpe ratio, max drawdown, and daily win rate
- Caveat: May perform poorly when trends reverse or markets become choppy
How to Judge Strategy Quality from Reports
| Check | Good Strategy | Poor Strategy | Notes |
|---|---|---|---|
| Annualized Return | Positive, > 10% | Negative or < 5% | Basic requirement |
| Sharpe Ratio | > 1 | < 0 | Risk-adjusted return |
| Max Drawdown | < 15% | > 30% | Maximum loss tolerance |
| Trade Win Rate | > 50% | < 30% | Paired-trade win rate |
| Profit/Loss Ratio | > 1.5 | < 1 | Average winner / average loser |
| Trade Frequency | Moderate | Too many or too few | Too many = high costs |
| Alpha | Positive | Zero or negative | Source of excess return |