Web Strategy Studio
The EasyQuant Web Strategy Studio is a browser-based quantitative strategy development and backtesting platform. No Python installation required — simply open a browser to write strategies, run backtests, view reports, and compare metrics.
Deployment Guide
If you need to set up the Web Studio, see the Deployment Guide.
Login & Authentication
The Web Studio uses JWT authentication to protect all API endpoints. Users must log in via pre-configured accounts — self-registration is not supported.
Login Mechanism
- The login page only supports login; user accounts must be pre-configured on the server (see "Pre-configured User Accounts" below)
- Tokens are stored in the browser's
localStorageand are valid for 24 hours - Auto logout: When a token becomes invalid (expired, invalid, or rejected with a 401 by the server), the frontend automatically clears the local auth state and redirects to the login page — no manual action required
Default Admin Account
| Username | Password |
|---|---|
admin |
admin123 |
The admin account is created automatically on first backend startup. In production, always change the default password via environment variable:
Pre-configured User Accounts
You can pre-configure multiple user accounts via configuration files or environment variables for team collaboration or demo environments.
Configuration File Method (Recommended)
Configure in web_strategy_studio/backend/users.yaml:
preset_users:
  - username: demo
    password: demo123
  - username: analyst
    password: analyst456
  - username: quant
    password: quant789
The backend reads and creates these users automatically on startup. Restart the backend after modifying the configuration.
Environment Variable Method
# Format: comma-separated list of username:password
export EQ_PRESET_USERS="demo:demo123,analyst:analyst456"
Using Both Methods Together
If both users.yaml and EQ_PRESET_USERS are configured, users from both sources will be created (duplicates by username are skipped).
JWT Secret Configuration
By default, the JWT secret is randomly generated on each restart (developer-friendly). In production deployments, use a fixed secret — otherwise all login sessions become invalid after a restart:
Token Mechanism
- After successful login, the token is stored in the browser's
localStorage - All API requests are authenticated via the
Authorization: Bearer <token>header - SSE real-time log streams use a
?token=query parameter because EventSource does not support custom headers - Tokens are valid for 24 hours by default (adjustable via
EQ_JWT_EXPIRE_MINUTES)
Permission Isolation
- Each user can only view and operate on their own strategies and backtests
- SSE log streams, report data, and other endpoints all verify ownership
- Subprocess environments filter sensitive variables (
EQ_JWT_SECRET,EQ_ADMIN_PASSWORD, etc. are never leaked to strategy code)
Interface Overview
The Web Studio uses a three-column layout:
| Area | Function |
|---|---|
| Left sidebar | Icon navigation bar with four entry points: strategy editor, backtest history, data management, and metrics comparison; theme toggle and logout button at the bottom |
| Center editor | Monaco code editor with built-in Python syntax highlighting, auto-completion, and error markers |
| Right panel | Backtest parameter configuration, run button, real-time logs, and report access |
| Top toolbar | Code lint, backtest history, metrics comparison, font size adjustment, and command palette |
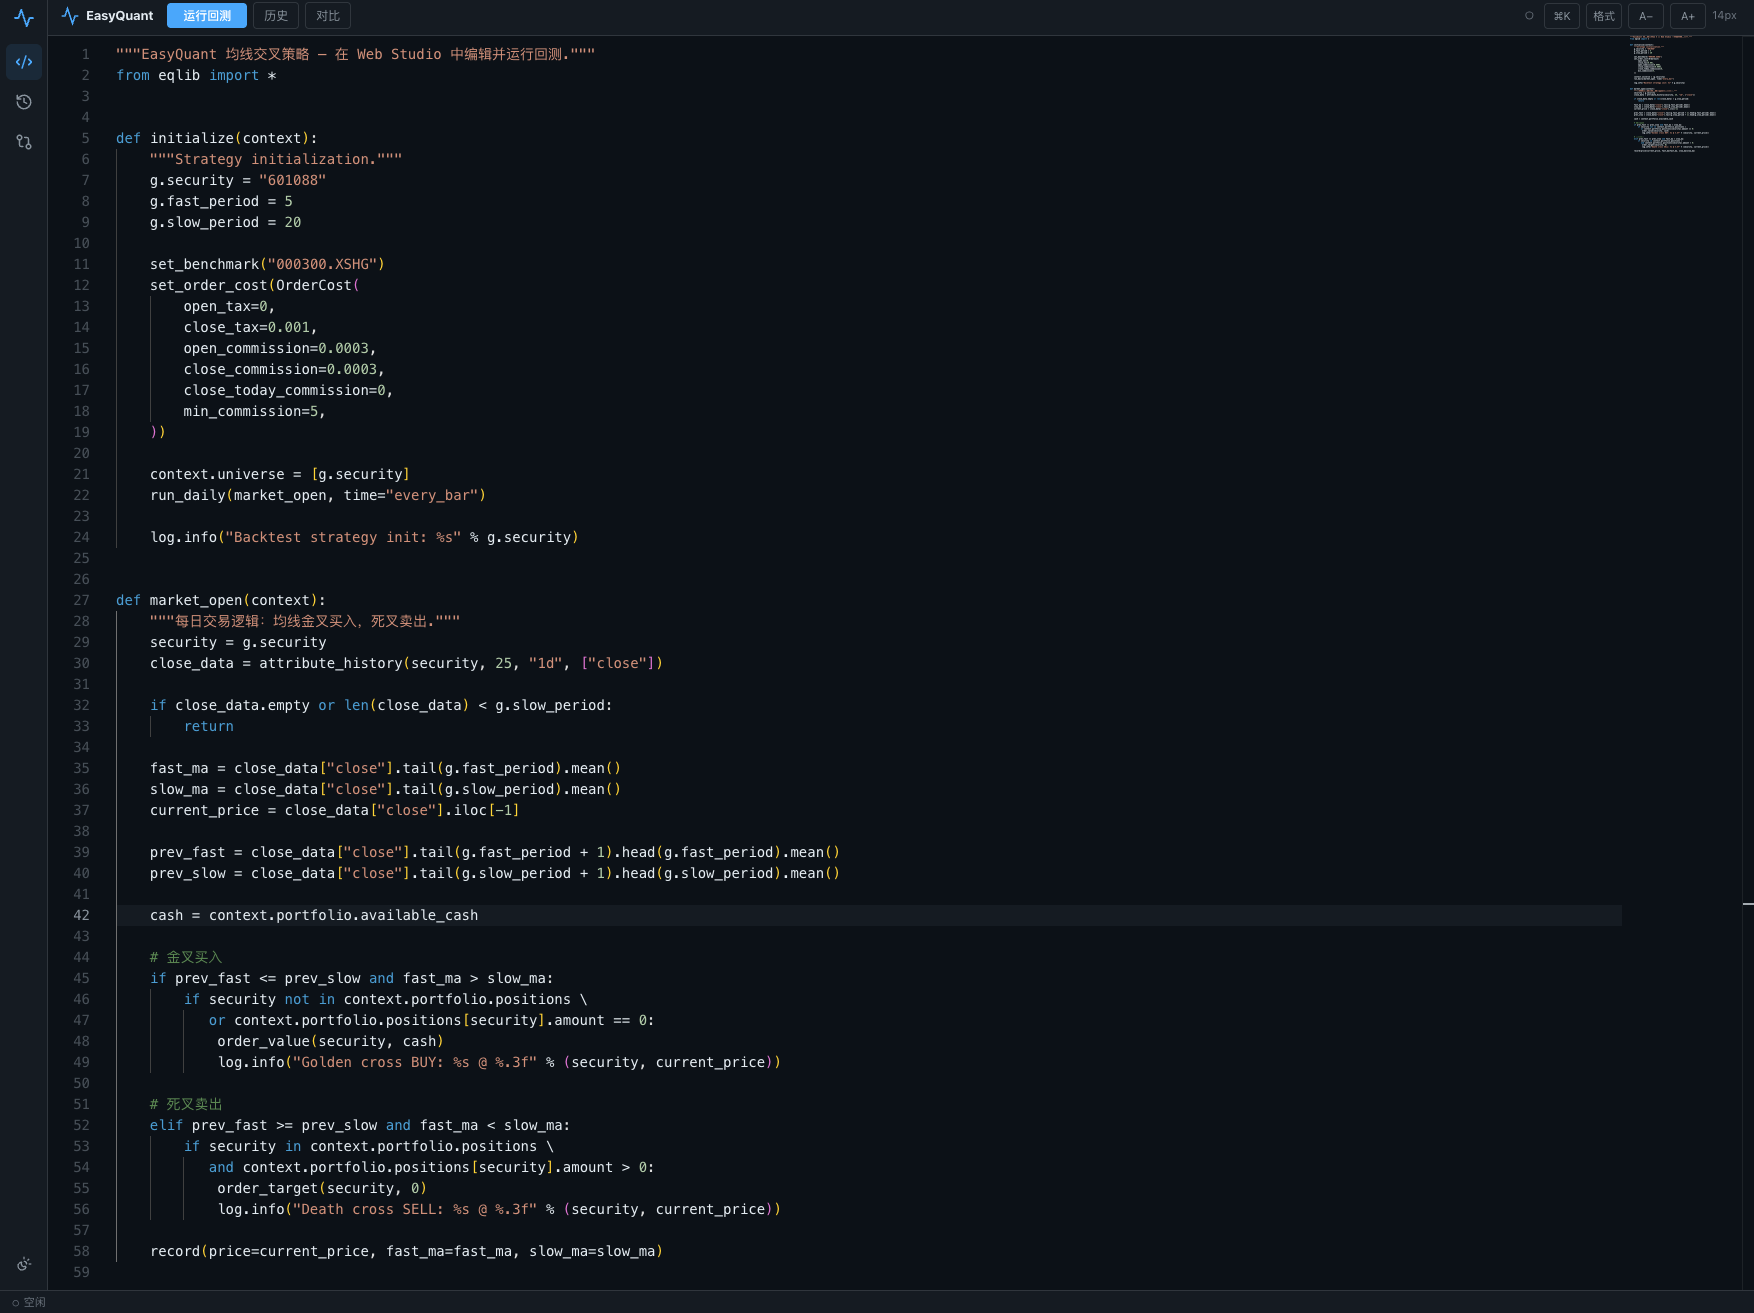
1. Writing a Strategy
The editor loads a moving average crossover strategy template by default, with the following core structure:
initialize(context)— Strategy initialization: set stock universe, MA parameters, order costsmarket_open(context)— Daily trading logic- Uses
attribute_history()to fetch historical candlestick data - Uses
order_value()/order_target()to place orders
You can directly modify stock codes, MA periods, stop-loss percentages, and other parameters — the editor auto-saves.
Tip: Press
Cmd+S(Mac) orCtrl+S(Windows) to run a code check. PressCmd+Enterto run a backtest.
2. Configuring Backtest Parameters
Configure backtest parameters in the right panel:
| Parameter | Description | Default |
|---|---|---|
start_date |
Backtest start date | 2024-01-01 |
end_date |
Backtest end date | 2024-03-31 |
benchmark |
Benchmark index code | 000300.XSHG (CSI 300) |
starting_cash |
Initial capital | 100,000 |
use_local |
Use local CSV data (recommended for faster speed) | ✓ |
3. Running a Backtest
Click the "Run Backtest" button on the right:
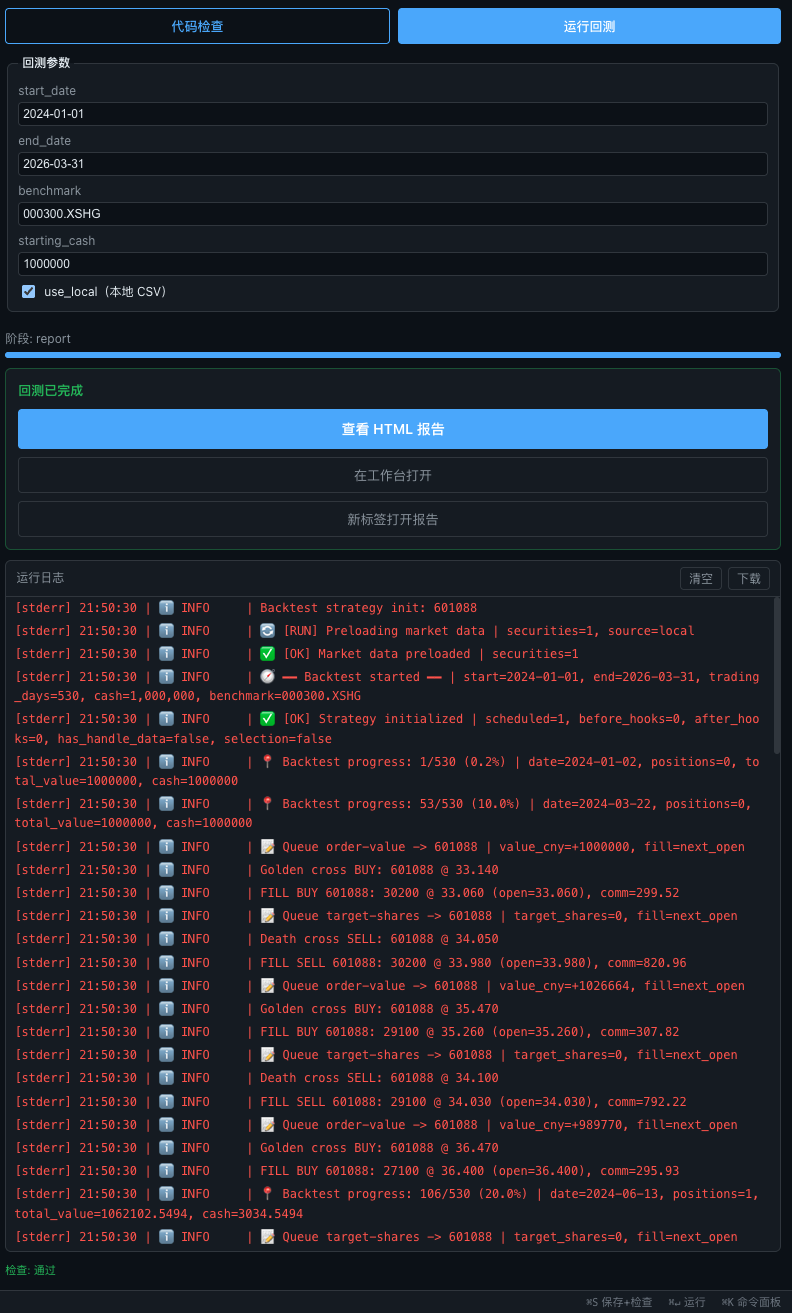
During the backtest you can see:
- Progress bar — Shows current progress and execution stage (fetch_data → validate → simulate → report)
- Real-time logs — Fill records for each buy/sell order
- Toast notification — Auto-popup when the backtest completes
- Success card — Provides two ways to view the report:
- View HTML Report — Preview in an overlay
- Open Report in New Tab — Full-screen view in a new browser tab
4. Viewing Backtest Reports
Click "View HTML Report" to open the report overlay:
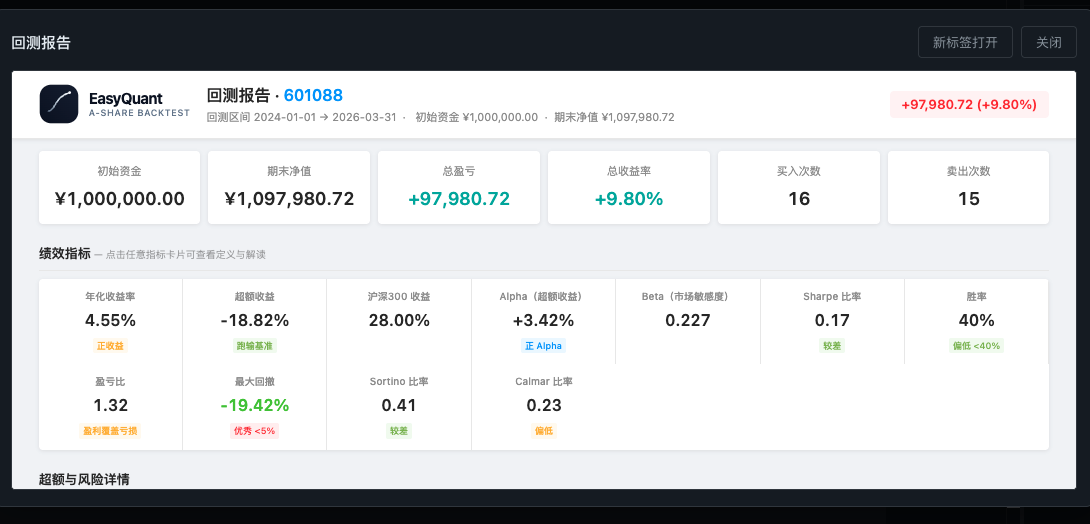
The HTML report includes the following modules:
- Overview cards — Initial capital, ending NAV, total P&L, total return rate, trade count
- Performance metrics — Annualized return, Sharpe ratio, max drawdown, Alpha, Beta, win rate, and 12 other core metrics
- Candlestick chart — OHLCV candles overlaid with MA5/MA20/MA60 moving averages, volume bars, and buy/sell signal markers
- Technical indicators — RSI(14), MACD(12,26,9), Bollinger Bands(20,2), shown in separate charts
- Indicator toggles — Button group in the top-left of the candlestick chart to independently toggle MA/BB/VOL/support-resistance
- Crosshair-linked legend — Real-time display of OHLC, moving average, and indicator values at the cursor position
- Cumulative returns — Strategy NAV vs. CSI 300 vs. SSE Composite
- Drawdown curve — Strategy drawdown relative to its own peak
- Daily P&L / Daily return — Bar chart display
- Timeline synchronization — All charts support linked zoom and drag
Native rendering: The report overlay in the Web Studio uses native Lightweight Charts for direct rendering (replacing the legacy iframe approach), with full crosshair sync, responsive scaling, and indicator toggle interactions.
5. Backtest History
Click the History icon in the left sidebar or the History button in the right panel:
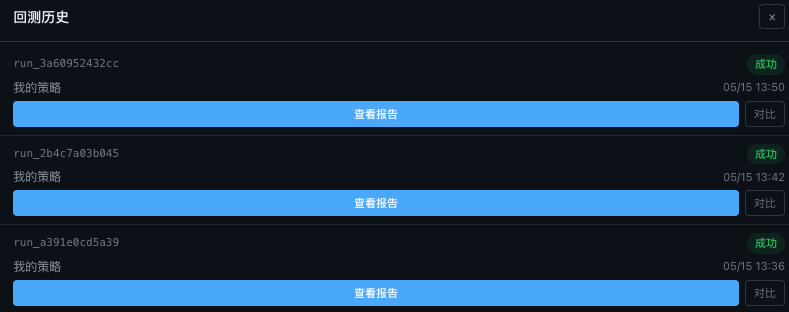
The history panel displays all backtest records:
- Each backtest shows run ID, strategy name, run time, and status
- Successful backtests have clickable "View Report" and "Compare" buttons
- In-progress backtests show a progress bar and a "Reattach" button (SSE connection can be restored after a page refresh)
- Select up to 5 backtests simultaneously for comparison
- Smart polling: Auto-refreshes every 5 seconds when there are running backtests; stops polling when all are complete to save resources
6. Metrics Comparison
Select 2 or more backtests in the history and click the "Compare" button:
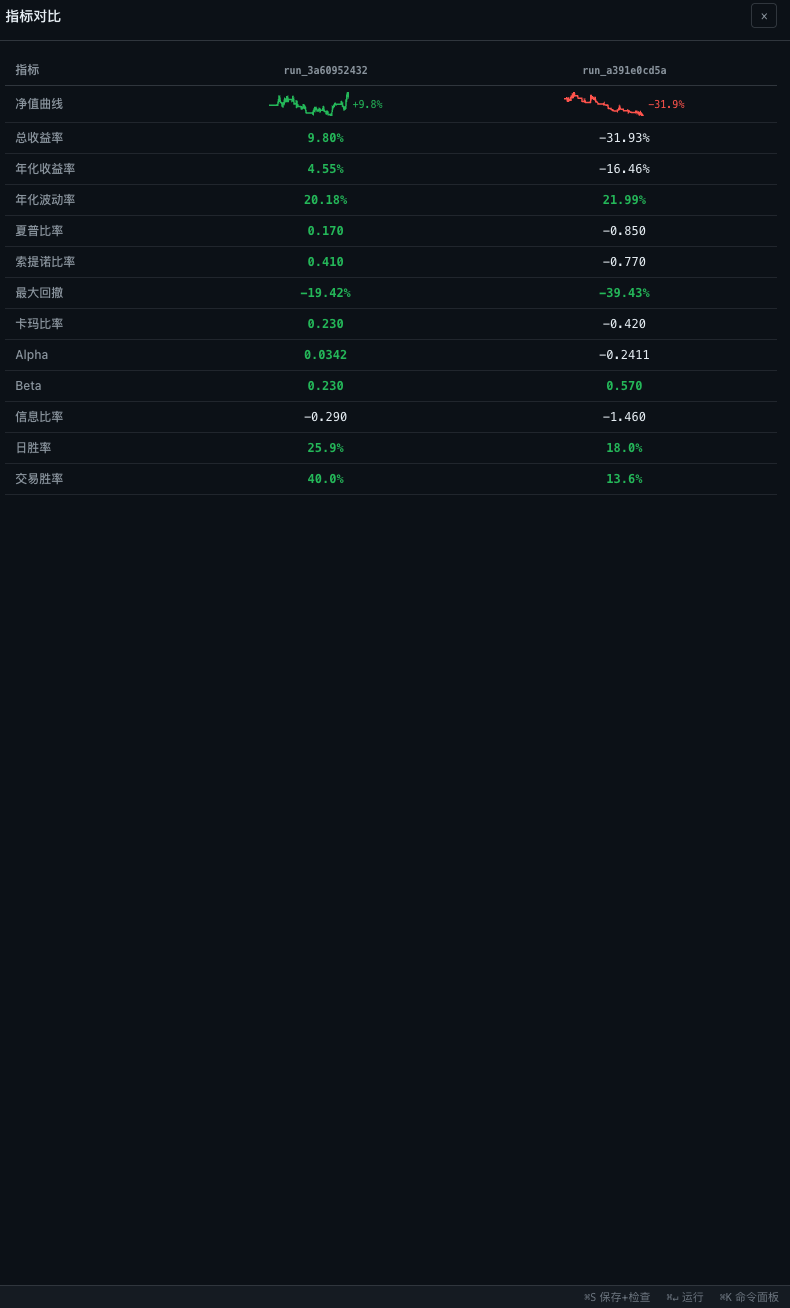
The comparison table displays the following dimensions:
| Dimension | Description |
|---|---|
| NAV curve | Lightweight Charts mini area chart (60x24px); green for period gain, red for period loss |
| Total return | Total return percentage over the period |
| Annualized return | Annualized compound return |
| Annualized volatility | Annualized standard deviation of daily returns |
| Sharpe ratio | Risk-adjusted return (higher is better) |
| Sortino ratio | Downside-risk-adjusted return |
| Max drawdown | Largest peak-to-trough decline |
| Calmar ratio | Annualized return / max drawdown |
| Alpha / Beta | Excess return relative to benchmark and market sensitivity |
| Information ratio | Active return / tracking error |
| Daily win rate / Trade win rate | Proportion of profitable days and profitable trades |
Values are auto-colored: green for positive metrics (returns, Sharpe, etc. > 0), red for negative metrics.
7. Code Check
Click the "Code Check" button in the toolbar (or Cmd+S) to run static analysis:
- Python syntax errors — marked with red squiggly lines in the editor
- Lint issues — marked with yellow squiggly lines (e.g., unused variables, non-standard naming)
- Security checks — flags potential security risks (e.g., hardcoded API keys, unsafe system calls)
8. Command Palette
Press Cmd+K (Mac) or Ctrl+K (Windows) to open the command palette:
- Quick-run a backtest
- Quick-format code
- Clear run logs
- Quick-navigate to history/comparison views
9. User Experience Features
Loading State Indicators
- Login button shows a loading animation on submit
- Stock search shows a loading state
- Backtest execution shows a progress bar with stage information
Accessibility
- Notification messages use
aria-live="polite"for screen reader announcements - Navigation buttons have clear
aria-labeldescriptions - Form inputs support auto-focus (
autoFocus)
Performance Optimization
- Backtest history list uses smart polling: only refreshes when there are active tasks
- Stock search requests are cancellable: new searches automatically abort the previous request
- SSE real-time logs properly clean up resources on component unmount
FAQ
Backtest Always Shows positions=0, No Trades
Check whether your strategy code sets context.universe = [...]. The Web Studio's data pre-loading depends on this configuration to determine which stocks' historical data to load.
Backtest Report Won't Open
Make sure use_local is checked and that the local data directory (data/) contains CSV files for the relevant stocks and date range.
Backtest Is Slow
Check use_local to use local CSV data — over 10x faster than fetching from the network in real time. The first run downloads data to the local cache.
Frequent Auto-Logout After Login
Check that the backend is running properly and that the JWT secret is stably configured (in production, set the EQ_JWT_SECRET environment variable — otherwise the secret changes on restart, invalidating all tokens). If the backend restarts, you need to log in again.
Theme Toggle Not Working
Click the sun/moon icon at the bottom of the left sidebar to switch between dark, light, and system-follow modes. Changes take effect immediately.